Hello.
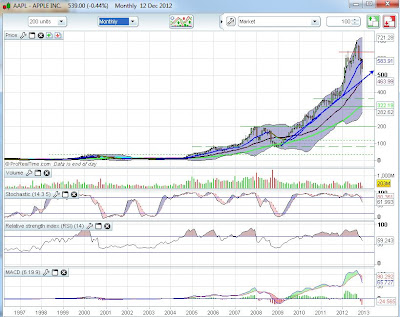
This is my first post where i will do a technical analysis to the Apple Stock. In this short analysis I will not use any fundamental data, or even important events, like the death of the Apple leader or the launch of a new product. I will maintain the analysis focused on the candles, signs, trend and support lines.
For my analysis I use mainly use the following:
- Stochastic Indicator
- RSI Indicator
- MACD Indicator
- Moving Averages ( 12, 26 and 52 days )
- Bollinger Band
- Trend lines
- Supports
- Resistances
What i see on Apple is an Evening Star built since Augut, and confirmed on November. In the monthly graph we see clearly that the sotck is trending downwards to the rasing trend line drawn with the blue arrow, and it seems not to have any sort of support until reaching it. Also you can see a strong sell sign on the MACD, which is not the best signal for the long traders, maybe a perfect one for the short side traders.
On the daily graph we can see clearly that the 532 USD for stock is behaving like a support, and the technical reaction performed since the 16th of November to the 3 of December has reached a ceiling, and the 532 USD mark is being threatened again.
If the 532 USD break occur the next support is the trend line in blue, near the 470 USD's, and if this is not enough to hold the sotck, than the big problems arise and we easily see that tere is not much support and the fall may go down to 364 USD's, a big fall.
On the contrary a positive signal would be the stock raise and break the 12 days moving Average, in brown and confirm this break by braching the resistance at 576USD's
Also a leave a video I have done to support this analysis,
Commentaries are welcome.


Sem comentários:
Enviar um comentário