domingo, 16 de dezembro de 2012

S&P, NASDAQ and Dow Jones Technical analysis 14 December 2012

Hello.

This is a technical analysis in video of the three main American indices, which in my view are quite in bad shape, two of them have already broke the twelve days moving average, and the third is almost breaking it.

The closure for the three indexes was:
Dow Jones - 13.135,01 Points
S&P - 1.413,58 Points
NASDAQ - 2.971,33 Points

Please have a look at the video of the analysis, and please forgive my bad english.


Bellow the images of each one of the indexes.

Dow Jones
 Nasdaq
 S&P


Thanks in advance

EMC Corp Technical Analysis 14 December of 2012

Hello.

I was asked to do a analysis about the EMC corp Stock, and this is my effort to find the short term path of the stock, which is not te most favorable to the long side.

The stock is just above the trend line that was started in november of 2008, which means that the stock will break a support with 4 years and several touches, a very strong one indeed.

The breakage of this support in my view can take te sotck in a pessimist look to the 15 USD's, but in a more optimistic view the 20,20USD's  support can do the trick and hold down the stock.

In a positive side, if in the next days the first support, the trend line that begins in 2008, inflicts a reaction on the stock, we may have a breath of air to the EMC stock, and see it test the 25,56 USD's again.


I leave the video here, for your analysis.


Thantks

Short Update to Apple Stock

Hello.

This is a short video update to the Apple stock, since my last analysis it has continued to fall, and this friday it has closed with a 3,76% fall to the 509,79 USD's.

My next support is the upward trend line at around 487 USD's, which if broken can easily take the stock to the next support at 421 USD's.

I don't see any signs of change in the downward movement, and the path continues to be open for the short side.

I leave the video for your analysis,


Thanks

quarta-feira, 12 de dezembro de 2012

Apple Inc. Technical Analysis 12 of December 2012

Hello.

This is my first post where i will do a technical analysis to the Apple Stock. In this short analysis I will not use any fundamental data, or even important events, like the death of the Apple leader or the launch of a new product. I will maintain the analysis focused on the candles, signs, trend and support lines.
For my analysis I use mainly use the following:
  • Stochastic Indicator
  • RSI Indicator
  • MACD Indicator
  • Moving Averages ( 12, 26 and 52 days )
  • Bollinger Band
  • Trend lines
  • Supports
  • Resistances 
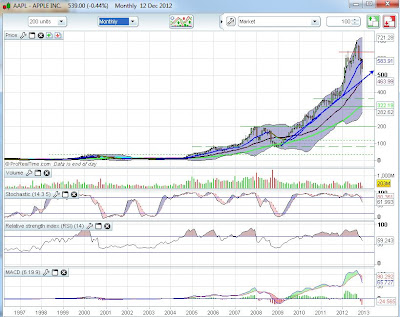
 What i see on Apple is an Evening Star built since Augut, and confirmed on November. In the monthly graph we see clearly that the sotck is trending downwards to the rasing trend line drawn with the blue arrow, and it seems not to have any sort of support until reaching it. Also you can see a strong sell sign on the MACD, which is not the best signal for the long traders, maybe a perfect one for the short side traders.

On the daily graph we  can see clearly that the 532 USD for stock is behaving like a support, and the technical reaction performed since the 16th of November to the 3 of December has reached a ceiling, and the 532 USD mark is being threatened again.

If the 532 USD break  occur the next support is the trend line in blue, near the 470 USD's, and if this is not enough to hold the sotck, than the big problems arise and we  easily see that tere is not much support and the fall may go down to 364 USD's, a big fall.
On the contrary a positive signal would be the stock raise and break the 12 days moving Average, in brown and confirm this break by braching the resistance at 576USD's


Also a leave a video I have done to support this analysis,


Commentaries are welcome.